Using Machine Learning to Improve the Smart Features of a Robotic Vacuum Cleaner
About the Project
The project involved data analysis and exploration and the application of machine learning algorithms to train models that could be used to add smart features to the Roomba i7+, a smart vacuum cleaner. The smart features were decided upon while keeping the context of the user in mind. The project revealed the immense potential of looking at large data sets to derive incredibly valuable insights and has equipped me to employ these methods in the design process.
The tools predominantly used for analysis were MATLAB and Orange along with Microsoft Excel for data preparation. The project was carried out as part of the Machine Learning for Intelligent Products course at TU Delft as a group of 4 during my master's in Design for Interaction.
My Role
Given my background in Engineering and my interest in Machine Learning methods, I took the lead role in this project guiding and equipping my team to ensure everyone is able to contribute critically and substantially. While I critically oversaw all aspects of the project, aspects of the project such as employing Orange for analysis and cleaning was done solely by me.
This Project Demonstrates...
-
Critically preparing and exploring data
-
Employing machine learning methods to explore unobvious relationships within large sets of data
-
An understanding of machine learning methods that will help in collaborating effectively with data scientists/AI engineers
The Process
This project was executed during the COVID-19 pandemic and was completed exclusively online within a time frame of 8 hours per week for 10 weeks. To make sure everyone could complete their own learning objectives and could contribute well, we decided that working asynchronously would work best. On the days we worked on the project, we had a short meeting at the start of the day to decide what each of us would work on and in the evening we showed each other what was complete by showing the work completed and share difficulties and roadblocks. Roadblocks and a perceived lack of speed were dealt with through collaboration and kindness and we overcame challenges as a team. The diagram below shows an overview of the steps taken during the project.
As can be seen below, the process is almost purely driven by quantitative data.

Understanding and Analyzing the Product
The first necessary step was to understand the functioning of the product and its current set of features. This would help to understand what are the potential improvements and what new smart features could be added. The methods used for analysis were a decomposition of functions, identifying the flow of materials and energy and text mining. The sections below elaborate on how these methods aided in identifying potential improvements and additions that would benefit the user.
The Roomba is an autonomous vacuum cleaning robot introduced by iRobot. The device consists of a host of sensors that are used for navigation. Unique from previous generations, the device comes with a mobile application and a cloud service. The app is used as an interface to control the device by initiating clean cycles, scheduling and further setting the intensity of the clean cycle. Device status such as battery levels and other device maintenance statistics are also visible through the app. The device also comes with a clean base, which is part of the docking station that helps the Roomba empty its waste by itself by employing a powerful vacuum. The user can later empty the contents of the clean base as it accumulates.
The video below by iRobot illustrates the same.
Function Decomposition
This method entailed breaking down each function into further sub-functions to look at the functioning of the device granularly. The image below shows a glimpse into how this was done. This process also helped identify which and what type of actuators, sensors and smart features were used in the product.

Material Flow and Energy Conversion
Identifying material flows and energy conversions was used to shed light on whether there could be ways in which the same could be optimized. Specifically, it would address concerns such as how energy efficiently energy was being used by the device. The image below indicates how this was done. The coloured arrows show the conversion of one type of energy into another and the double lines indicate the flow of material.

Given the complexity of the diagrams produced as a result of the methods mentioned above, they are not completely presented on this page. Please click here to see the complete images.
While there were several aspects identified as areas for improvement, one that stood out was the need for need for improving power usage: The current Roomba model makes several rounds on the floor while cleaning after which it adjusts its cleaning intensity/suction power based on the amount of dirt it finds on the floor. This leads to inefficient use of power. For instance, if the dirt levels are high in a particular region, the Roomba takes multiple rounds to completely detect dirt levels in that area to adjust its suction power to what would be appropriate to the dirt level. This affects not only the energy consumed but also the time taken for the Roomba to complete cleaning a room.
Text Processing
Orange, an open-source tool was used for text processing. This was used to derive insights from unstructured data collected from 300 tweets and further also from a few online articles from The Guardian as well. As the focus on making the device smarter in the context of the user, it was important to understand what emotions people reflected through tweets about the Roomba. A notable find was the loud noise of the Roomba, especially at odd hours which seems to put people off.
Understanding, Preparing and Exploring the Data
The data set that was analyzed was provided at the onset of the course. The data set had a lot of null values, duplicates and values such as dirt levels were continuous which at times would be more appropriately analysed if binned. All the initial data processing was done on Microsoft Excel.
Data Exploration
Scatter plots of the data were created to explore and understand the data and how it is distributed. Here the coordinates of the floor of the room are plotted on an X-Y plane and both dirt levels and sensor input was explored with respect to the same.
This showed clearly that from the data it is possible to observe differences in how dirt is distributed both across time (time of the day and the day) and on the floor. This exploration made the data more tangible as design material that could be used to conceptualize how the device could be made smarter.

X-axis: Time of the day | Y-axis: Dirt level | Colour: Day of the week
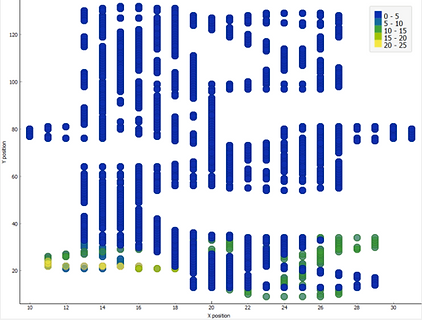
X-axis: X-position | Y-axis: Y-position | Colour: Dirt level
Uncovering Relationships within the Data Features
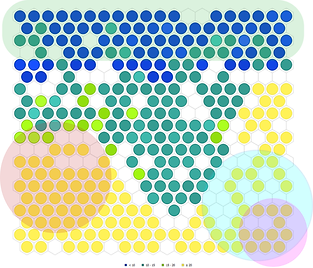
A Self-organising map (SOM) is an unsupervised machine learning model that is used to identify potential clusters within large data sets. As the clusters are identified by the algorithm, the SOM makes it easier to visualize and identify non-obvious relationships. On the SOM map, similar members are placed closer together.
The below diagrams show variations in clustering as we look at the SOMs using various conditions such as levels of dirt, day of the week and time of the day. To illustrate how the map can be interpreted, let's take the example of the SOM with day of the week as shown below. Here each colour indicates a day of the week. When colours are seen in close proximity with each other we see a formation of clusters. For instance, the close proximity of green circles which stand for Saturday, indicate a formation of a cluster with the above-mentioned inputs.
This can be overlapped with the other SOMs to draw possible relationships. If we observe the day of the week SOM and dirt level SOM we see that there are large clusters for Saturday (light green) and for low dirt levels (dark blue). When overlapped this could mean that we can associate Saturday with low dirt levels. While this example is simplistic, it aims to illustrate how SOMs can reveal relationships between data features (such as day of the week, dirt levels etc.) that we might otherwise not see. This is particularly valuable when the data set is too large to plot and observe clearly using a scatter plot.

Day of the Week
Time of the Day

Dirt Levels
Insights from the SOM map were:
-
Clearly observable clusters for Friday, Saturday and Wednesday.
-
Dirt level clusters are predominantly at lower levels.
-
Clearly defined large clusters are formed for when the device is active at night. Smaller clusters exist for when it is active during the day.
-
It was also interesting to look at the overlaps in the Self-organising map which revealed to us probable dirt levels on particular days and time. (Indicated by the translucent shapes)
These findings address the need for the Roomba to run at just the needed level of power. Knowing what factors influence cluster formation helped develop combinations of features that make better predictions.
Deciding Smart Features
Based on the preliminary analysis of the product and after looking at the accounts from users and potential consumers, the feature that could improve the product is the ability to keep track of the dirt distribution across time. The data exploration also revealed that the data collected from the Roomba can be used to clearly observe user behaviour. This also sheds light on what models could be feasible based on the available data.
Improving Efficiency through Predicting Dirt Levels
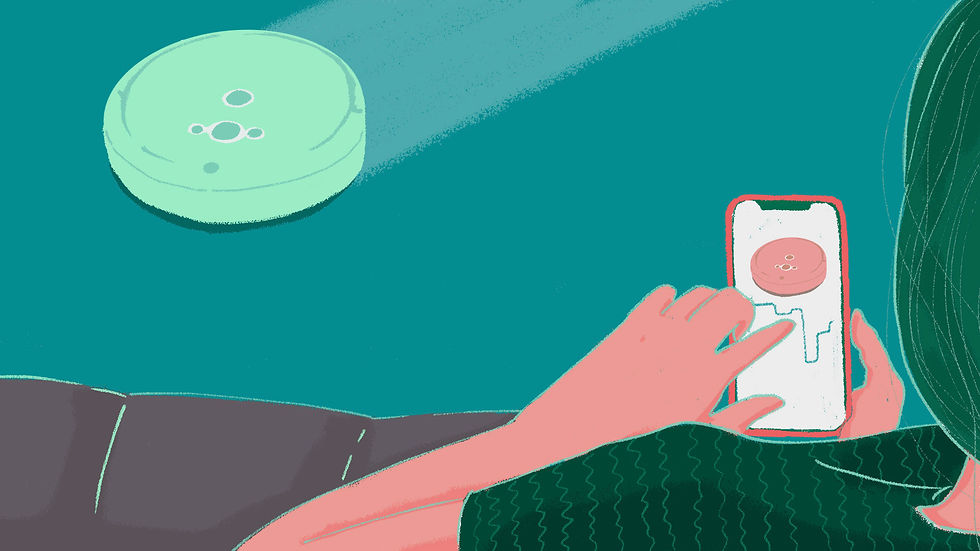
As mentioned before, the Roomba has to make multiple passes before it senses the dirt levels and responds appropriately. The data also showed variations in how dirt was distributed at different times and locations. A more efficient scenario would be a case where the Roomba is able to pre-empt the suction power needed to clean a particular region before even needing to make multiple rounds to detect increased dirt levels. Let me illustrate the same with the help of a storyboard.


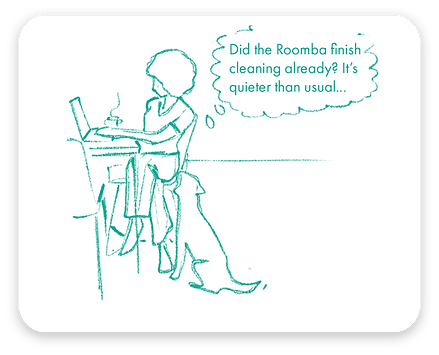
Nancy, the user would notice that the Roomba finished the cleaning cycle quicker than it had 3 days ago. This was the cleaning cycle that started after Nancy returned from Pogo's daily walk. As the preliminary research had shown that some users found the Roomba too loud, a cleaning session ending in a shorter time also has less noise produced as an added benefit.
This was because the Roomba finished its cleaning cycle quicker than usual as it was able to reduce the amount of time it takes to detect dirt levels by depending on trends it observed from previous user behaviour in the last few days.
This makes the Roomba consume power more efficiently as well.
For the above mentioned smart feature, the value the needs to the predicted is the level of dirt at a particular time and location which would reduce the time the Roomba takes to adapt to encountered dirt levels. The next step would be to identify what machine learning models would be most suitable for the same.
Choosing the Right Model and Validation
Classification and Regression were decided to be the potential methods that could be used to create models for prediction. Classification can be used to predict the expected levels of dirt (low, medium, high) and Regression could be used to predict a numerical value of expected dirt level (19, 20 etc.) at a given point in the room. MATLAB applications were used to train the concerned models.
Classification
Initial data analysis had revealed that there are a large number of low dirt levels in comparison to higher values. To classify high-level values with sufficient accuracy, the dirt levels were categorized into low, medium and high. Very low dirt values were also removed from the data to train the classifier to reduce the issue of an imbalanced dataset.
The inputs that were considered were Day of the Week, X position, Y position and Time of the day and the output as Dirt levels. The accuracy was 99% using a fine tree algorithm.
There is however a caveat as this might be a case of over-fitting as the data was produced from a simulation.

Regression
On providing inputs such as X position, Y position, Time of the Day and Day of the Week, a Dirt Level value would be the expected output.

As can be seen from the residual plot, the regression model would work well till around a dirt value of 15 after which it exhibits heteroscedasticity. That said with a Root Mean Square Error (RMSE) value of 0.067, the model could still perform perfectly well. This is because the data set used for training had a minimal number of high values and the medium values were also less in comparison with lower values. Hence, training a model with a large data set could give lower errors in the higher values. That aside, it could also mean that high values are seldom encountered and hence need not be something that is a cause for concern.
Classification Vs. Regression - Product Behaviour
Both the classification and regression models showed promising results in terms of predicting the dirt levels, but in two different ways. The visual below indicates how the Roomba would function when either model is used.

As the Roomba moves across the room and receives the mentioned inputs, it predicts the dirt level or value that it would encounter. As mentioned before, this eliminates the need to scan the floor multiple times to adjust its power to new dirt levels. While both models work in theory, Classification might be a better model to implement as it already provides the required granularity by just predicting whether the dirt levels would be low, medium, or high. While using a regression model provides numerical output, and the Roomba can vary its power according to these numerical values, it also is computationally expensive. It would have to change parameters such as suction power and speed more often with respect to the dirt values that it would predict to encounter. Classification hence might prove to be more efficient.
While I mention this, it should be noted that the data set provided for the course was without contextual information. For instance, we did not know what these dirt values themselves mean and what types of dirt they correspond to. The information regarding the computational capacity of the Roomba is unclear making it difficult for us to decide what the Roomba can handle on the onboard processor. However, as the Roomba is a connected cloud device, it is safe to assume that the models would be trained on cloud servers based on the data collected by the Roomba.
Final Thoughts
This project presented an incredibly engaging learning curve where through a low code approach, I was able to dive deep into several machine learning techniques and see how they help in the decision-making process. The process enabled me to understand both the great benefits as well as the pitfalls of using such methods. Ideally, the design process would be supplemented by both quantitative and qualitative methods providing more insight into the context as well.
I would resort to using the skills picked up in this project in future projects where big data plays a role, leveraging the potential of these techniques in drawing out unseen relationships between data features, ultimately supporting my design process.